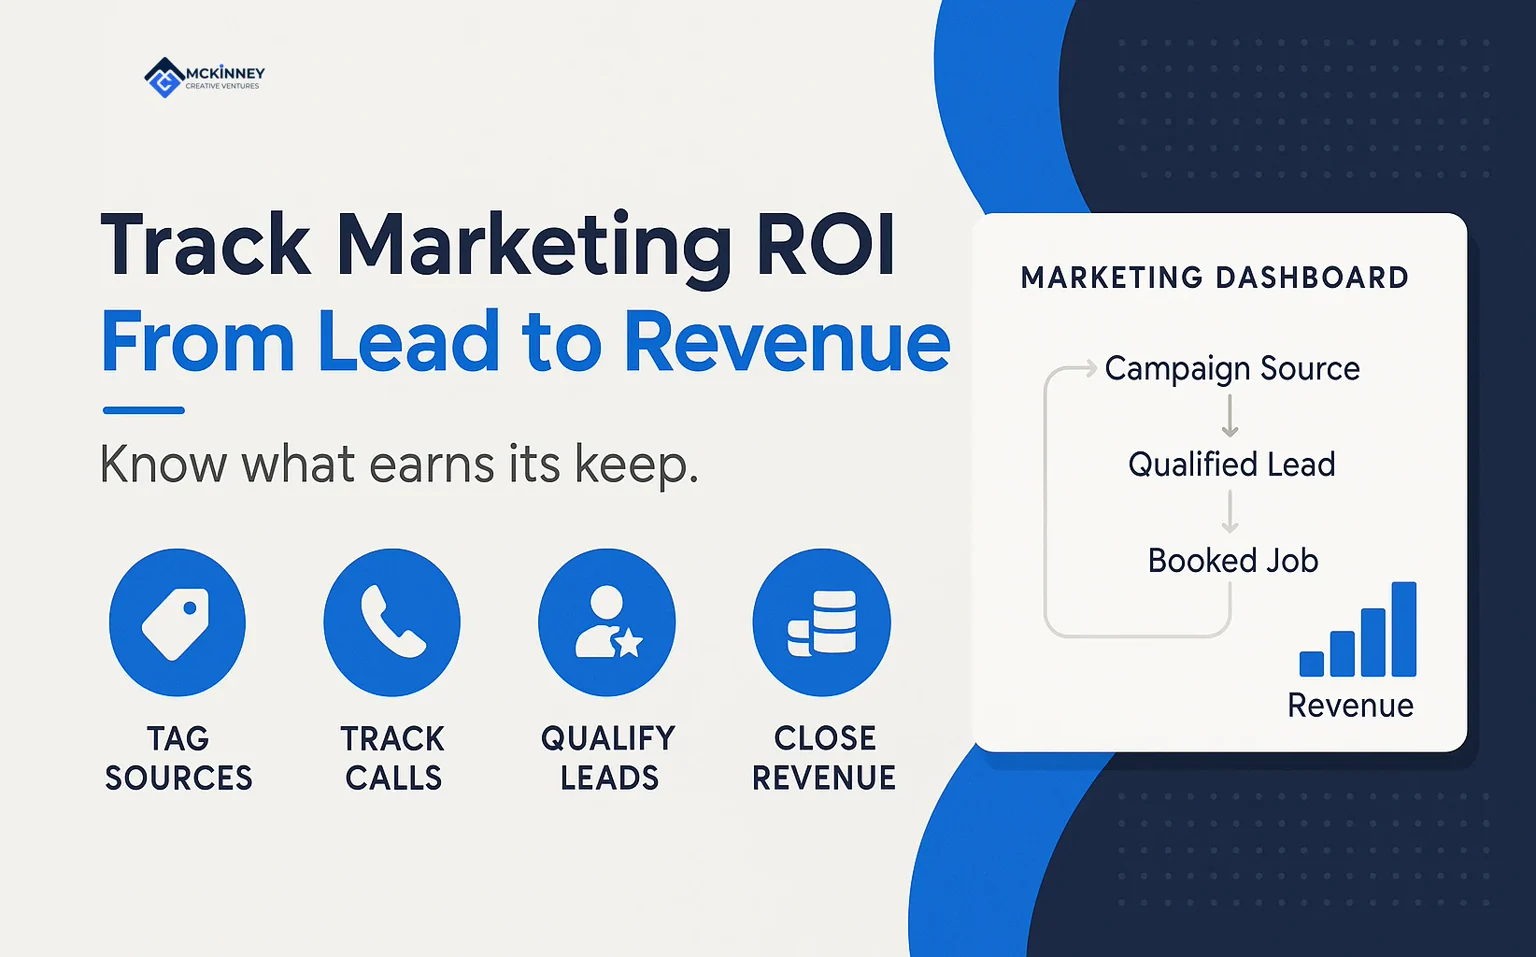


A small business marketing budget for a local service business is easiest to set by working backward from the jobs you want, what a job is worth, how often a lead turns into a job and what a lead costs you. Percent-of-revenue benchmarks exist, but they describe other companies. This guide is for owners of plumbing, HVAC, roofing, landscaping and similar businesses in the Twin Cities East Metro, the St. Croix Valley and western Wisconsin, and it shows what the benchmarks measure, how to run the job math, how to split the money, how seasons change it and how to check it.
We give no dollar figure for what any business should spend, and we do not state what our own work costs. The one worked example uses an invented business with invented inputs, and nothing in it is a typical price or cost.
How much of revenue should a small business spend on marketing?
A July 2019 post on the U.S. Small Business Administration's blog, written by Rieva Lesonsky, CEO and President of GrowBiz Media, says there is no hard and fast answer. It says many businesses use a percentage of revenue as a guide, that a startup should use projected revenue, and that the percentages vary widely. The post adds that business-to-consumer companies generally need to budget more than business-to-business companies, that a new business needs more than an established one with a steady customer base, and that an industry trade association may publish benchmarks. The post quotes averages from two other publications, one for advertising spending and one for 2018 marketing spending, without describing who was measured, and it does not set a percentage for you.
The most current survey we could read in full is The CMO Survey, sponsored by Duke University's Fuqua School of Business, Deloitte and the American Marketing Association. Its 35th edition was in the field from January 7 to 29, 2026. It went to 2,111 marketing leaders at U.S. for-profit companies, and 308 responded. The question was what percent of company revenue marketing expenses account for. Among the 154 valid answers the mean was 8.96 and the median was 5, and in our reading that gap suggests a few large answers pull the mean up.
The same survey's breakout report splits those answers by company type. The table shows what each figure covers, and the last column is our reading of how far it reaches.
Scroll to see all columns
| Figure | Who it describes | Why it may not fit a local service business |
|---|---|---|
| Mean 8.96, median 5 (CMO Survey, January 2026) | 154 marketing leaders who answered, at U.S. for-profit companies | In our reading the sample leans toward large companies, and the survey does not single out local trades |
| Mean 7.24 for business-to-consumer services | 18 respondents in that group | Services here is a broad group, and 18 answers is a small base |
| Mean 13.34 for companies under $10 million in sales | 20 respondents, with a standard deviation of 13.21 | Answers varied widely, so the mean is a loose guide for any one company |
| Percent-of-revenue averages quoted in the 2019 SBA blog post | Presented as a common starting point, with averages quoted from other sources | The post is from 2019 and says percentages vary widely |
In the Topline Report, 39 of the 299 respondents who reported sales had under $10 million, so 87 percent reported $10 million or more and 47.5 percent reported $500 million or more. In the breakout report, only 3 respondents each in the mining and construction group and in the consumer services group answered the marketing-spending question. In our reading, none of this describes an East Metro plumber or a Hudson, Wisconsin landscaper, so use the numbers only as a rough check on your result.
Work backward from jobs: the small business marketing budget method
Working backward turns the budget into arithmetic you can check against your own books. Use numbers from your invoices and your phone and form records, and write down which are measured and which are guesses.
- Decide what you want from marketing: a revenue goal from new customers, or the open capacity your crew has in a typical month.
- Find your average job value from recent invoices.
- Divide the goal by the job value to get the number of jobs needed.
- Find your close rate, meaning the share of leads that become booked jobs, from your own records. Divide jobs needed by it to get leads needed.
- Subtract the leads that referrals and repeat customers already supply.
- Multiply the leads you still need by your cost per lead on each paid channel, taken from your own spend and lead counts.
The result is the media budget for the period. The fixed lines come on top, and our guide to the cost of marketing for small business lists them and sorts them into fixed and variable.
Here is an illustrative example with an invented business. Cobblethorne Drain Care is a made-up Woodbury company. The inputs below are invented to show the arithmetic and are not typical prices, costs or benchmarks.
Scroll to see all columns
| Step | Invented input | Result |
|---|---|---|
| Jobs wanted from new customers each month | 12 jobs | 12 jobs |
| Average job value | $1,500 | 12 jobs are worth $18,000 |
| Close rate | 4 of every 10 leads book | 12 jobs need 30 leads |
| Leads from referrals and repeat customers | 10 leads | 20 leads must come from paid channels |
| Cost per lead on the paid channel | $60 | 20 leads cost $1,200 |
| Jobs those paid leads produce | 20 leads at 4 in 10 | 8 jobs worth $12,000, at $150 of media per job |
Check the arithmetic: 12 jobs at $1,500 is $18,000, 12 divided by 0.4 is 30 leads, 30 minus 10 is 20, 20 times $60 is $1,200, 20 times 0.4 is 8 jobs, 8 times $1,500 is $12,000, and $1,200 divided by 8 is $150. The 10 leads from referrals and repeat customers, at 4 in 10, supply the other 4 jobs, and 8 plus 4 gives the 12 jobs wanted. Set against the invented revenue, $1,200 of media is about 6.7 percent of the $18,000 from all 12 jobs and 10 percent of the $12,000 from the 8 jobs the paid leads produce, so the percentage depends on which revenue you count. These percentages come from invented inputs and set no target, and in our reading the same ambiguity is a reason to treat the percent-of-revenue averages quoted in the 2019 SBA blog post as a rough check only. The example ends with a number the owner can test, and a month of real results will show which input was wrong.
Two cautions. A new business, or one that never tracked sources, has no close rate or cost per lead to use. In that case, run a short, capped test on one channel, record every lead and booked job, and replace the guesses with measured numbers. And do not buy more leads than the crew can serve. The budget should stop at capacity, because a lead nobody can book is money spent for nothing.
Foundation first, then channels
Once you have a number, split it between the things that make any channel work and the channels themselves. Our view is that a minimum foundation has three parts: a website that works on a phone and shows one clear way to call, a claimed and accurate Google Business Profile, and a way to see which source each lead and booked job came from, even if that is a spreadsheet. Those are our judgment about the minimum and no rule sets them, and a business with an existing site and profile may already have most of it. Our guide to the cost of digital marketing for small business explains how each service is priced, so we leave prices out here.
The channels get what remains. In our experience, adding one channel at a time makes results easier to read, because you can tie a change in leads to a change you made. Local Services Ads show how a lead-based channel turns the budget into a weekly setting. Google's page on how leads work says you are charged for each valid lead, that lead prices may vary by location, job type, lead type or bidding mode, and that each lead counts toward your budget. Google's budget page says the average weekly budget is your target spend, that some weeks you may spend less and others more, and that the monthly maximum is the weekly budget times 30.4 divided by 7.
In our arithmetic, a $1,200 monthly maximum matches a weekly budget of about $276, because $276 times 30.4 divided by 7 comes to roughly $1,200. That is an illustration of the formula, and the right figure for your account depends on the cost per lead you actually see.
How Minnesota and Wisconsin seasons change the number
A yearly budget is rarely spent evenly. In our experience, a furnace company, a lawn company, a roofer and a snow removal contractor in the East Metro and the St. Croix Valley each have busy and slow stretches, and the stretches differ by trade. The same budget should follow them.
Use your own history. List your booked jobs by month for the last year, find each month's share of the year, and spread the yearly media budget by those shares. Then move spending earlier than the demand, because in our experience it takes time for pages, profiles and campaigns to start producing leads. When the crew is booked full, trim spending, since leads you cannot serve add cost and no revenue. Our seasonal marketing calendar for Minnesota service businesses covers the month-by-month timing, so this guide stops at the method.
If your service area spans the St. Croix, check whether demand differs on the Wisconsin side. A business that works on both sides of the river may find that each state has its own licensing and permit rules, so confirm them with the state agencies for your trade and with your city or county. The booked-jobs list by town will show whether one side deserves a larger share.
Check the budget against booked jobs
A budget is a hypothesis until the jobs come in. Each month, write down the spend, the leads, the booked jobs, the revenue and the source for each, then compare cost per booked job with what a job earns after your own costs. Review the number after each season and after any big change. One month of results is a noisy basis for a decision.
Cutting spending when sales slow deserves care. The 2019 SBA blog post describes a chicken-and-egg situation in which sales drop, the budget is cut and sales fall further, and says slowing sales might be the right time to increase marketing, especially in a slow economy when others cut back. We would first check why sales slowed. If the phone is quiet, a marketing change may help. In our experience, if the phone is ringing and jobs are not booking, follow-up, pricing or lead quality is a more likely cause than the amount of media, and more spend may not help.
Our digital advertising work covers Google Search, Local Services Ads, and Meta, managed against booked jobs instead of clicks, and you can contact us if you want help working through the numbers.